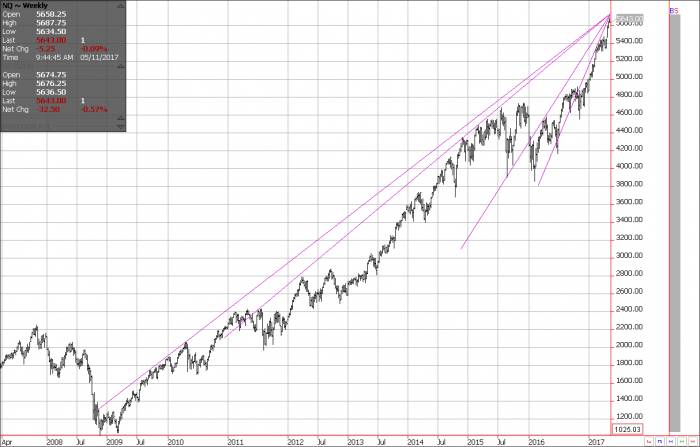
I’m always looking at geometric formations on a variety of different futures markets. I think the weekly continuation chart of the Nasdaq 100 futures may be offering us a clue to a potential target in price and time. No one can deny the dynamic rally that we’ve seen in the tech sector since the lows were made in March of 2009. Prices of this index have rallied from the low of 1040.25 during the week of March 13th 2009 to this week’s high of 5687.75. That’s a $92,950 move in a little more than 8 years. Can this market keep moving higher? Of course it can, but I think it behooves us to look at the math to see if we can make any predictions or calculate any resistance points. In my opinion, the attached chart demonstrates a target point. Keep in mind, this chart you’re viewing is a long term chart with longer term implications. I’m not necessarily suggesting that the bull market is over for the Nasdaq tech sector. But I AM suggesting that maybe we’ve moved far enough for now. We must realize that the algorithmic traders that control significant sums of money base their buying and selling activity on data or numbers. This is what tends to make the math work. Computerized program trading is here to stay. We just need to try and understand the nuances of how the data translates to market activity and direction. We have strategies and suggestions on how you can position yourself and/or your investment portfolio. Don’t just stay in step, trade with the edge!
The risk of trading futures and options can be substantial. Each investor must consider whether this is a suitable investment. Past performance is not indicative of future results.
