
Are These Resistance Lines Pointing to a Top??
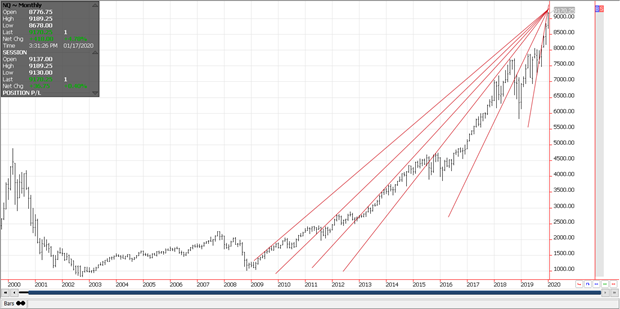
Ill be the first to admit that I’m always looking for an excuse to fade the extremes in the stock indices. I’ve been a commodity broker for almost 40 years. I’ve seen abject carnage in the stock market too many times to count. I’ve witnessed 4 recessions. I’ve experienced four dramatic corrections in the Dow Jones Industrial Average (DJI) of 25+%, 16+%, 25+% and 50+%. So when I see something that I think bears watching…….I tend to pay attention. I don’t think anyone would argue with the opinion that the Nasdaq Index has led the market for the last 10 years. The Chart below is a monthly continuation of the Emini Nasdaq Index going back To January 2001. I’ve drawn what I believe to be resistance lines from some of the weekly highs that have been achieved as the market has gained greater angles of ascent. It is my opinion that these resistance lines all point to this 9175 to 9275 area as a potential target point. I would suggest that traders use this opinion to lay off risk in their stock portfolio or consider initiating short or sell positions with futures and or options in the Emini Nasdaq, or Emini S&P or Emini Dow contracts. Please feel free to contact me @ 877-304-1369 or steve@efggrp.com to discuss specific strategies. But do yourself a favor and pay attention to the point of resistance.
The risk of trading futures and options can be substantial. Each investor must consider whether this is a suitable investment. Past performance is not indicative of future results.